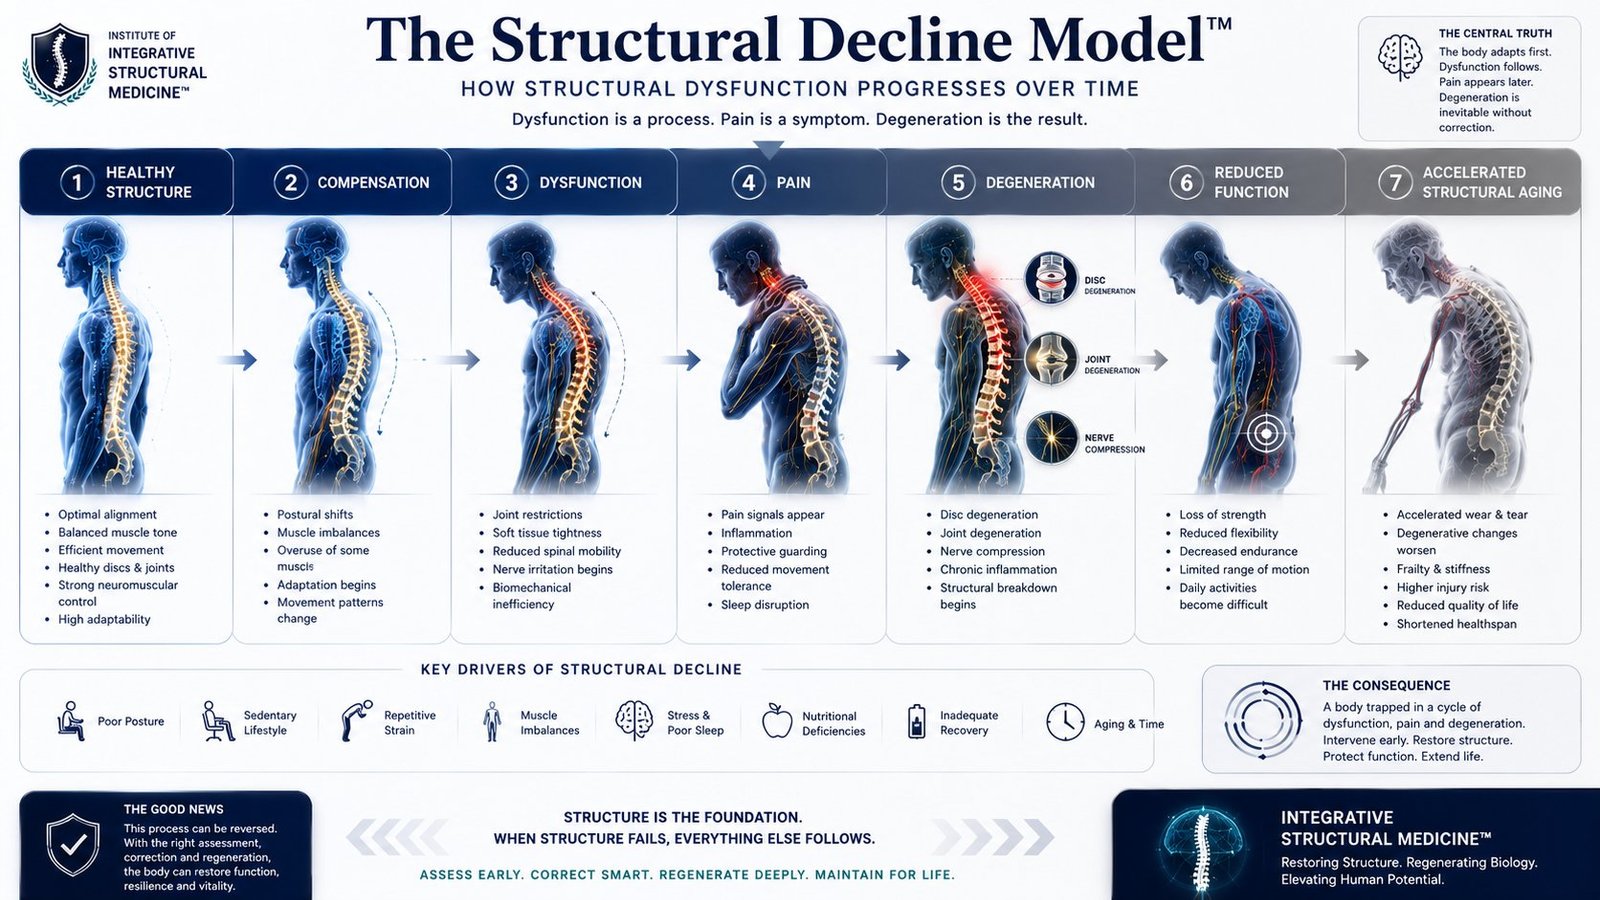
The Structural Decline Model shows how a spine problem develops over time. It is not a sudden event. It is a process — a slow progression through seven stages, from a healthy structure to accelerated aging of the structure. This page explains each stage, what drives the process, and the important part: that the process can be slowed, and in many cases reversed, if it is caught early enough.
The central truth
The diagram states its central truth at the top: “The body adapts first. Dysfunction follows. Pain appears later.” That order matters. Pain is the fourth stage, not the first. By the time pain appears, the body has already been adapting and compensating for some time. And the diagram adds a second line: “Dysfunction is a process. Pain is a symptom. Degeneration is the result.” Pain is the signal that something has been going wrong for a while — not the beginning of the problem.
The seven stages
1. Healthy structure. The spine is aligned, the muscles are balanced, movement is efficient, the discs and joints are healthy, and the nervous system controls movement well. The body adapts easily to load.
2. Compensation. The body begins to adapt to a problem. Posture shifts. Some muscles become overused while others weaken. Movement patterns change — the body finds a way around a restriction, and the new pattern feels normal. Nothing hurts yet. This is the stage where the problem is easiest to correct, and the stage where it is most often missed, because there is no pain to report.
3. Dysfunction. The compensation starts to cost something. Joints become restricted. Soft tissues tighten. Spinal mobility reduces. Nerves begin to be irritated. Movement becomes less efficient — the body is working harder to do the same things. Still no pain, or only occasional discomfort.
4. Pain. Pain signals appear. Inflammation is present. The body guards the painful area, protecting it by limiting movement. Tolerance for movement reduces, and sleep is disrupted. This is the stage where most people seek help — not because the problem started here, but because the pain started here.
5. Degeneration. The structure itself begins to change. Discs degenerate. Joints degenerate. Nerves are compressed. Chronic inflammation sets in, and structural breakdown begins. This is the stage where the changes become visible on a scan — but the process that caused them started much earlier.
6. Reduced function. Daily life becomes harder. Strength is lost. Flexibility reduces. Endurance decreases. The range of motion is limited. Activities that were once easy — climbing stairs, lifting, sitting for a long time — become difficult.
7. Accelerated structural aging. Wear and tear accelerates. Degenerative changes worsen. The body becomes frail and stiff. The risk of injury rises. Quality of life is reduced, and the healthy years of life are shortened.
What drives the decline
The diagram lists eight drivers — the forces that push a person along these stages: poor posture (the shape the body settles into, hour after hour); sedentary lifestyle (too much sitting, too little movement); repetitive strain (the same movement, repeated, day after day); muscle imbalances (some muscles overworked, others weak); stress and poor sleep (stress that is not managed, and sleep that does not restore); nutritional deficiencies (the body not given what it needs to maintain its tissues); inadequate recovery (no time or conditions for the body to repair itself); and aging and time (the simple fact that load accumulates over the years). None of these is a single cause. Decline is driven by several of them at once, over a long time. That is why two people of the same age can be at very different stages.
The consequence — and the good news
The diagram is blunt about where the process leads if it is not interrupted: a body trapped in a cycle of dysfunction, pain, and degeneration. The advice is equally direct: intervene early, restore structure, protect function, and extend quality of life. The earlier the intervention, the less there is to reverse.
The diagram does not end on the decline. It has a panel called “The good news”: the process can be reversed. With the right assessment, correction, and regeneration, the body can restore function, resilience, and vitality. That needs to be stated carefully. Reversal does not mean a damaged disc becomes new again. It means the function can improve — the pain can reduce, the movement can return, the strength can be rebuilt, and the decline can be slowed or stopped. The method works on the pillars that are struggling, and when the pillars improve, the structure improves with them. That is recovery, not cure.
How the model is measured
The model is not only a picture. It is measured. The SBRA assessment scores the structure and the biology, and the scores show where a person is on this progression. The Structural Integrity Score, out of 100, sums up the condition of the structure. Structural Age expresses that condition in years, compared with the person’s actual age. The Recovery Capacity Score shows how much capacity for improvement the body has. Together, these numbers place a person on the model — and when they are measured again at follow-up, they show whether the plan is moving the person back toward the healthy end, or whether the decline is continuing.
What this means for you
For a patient, the model explains why pain is not the whole story — it appears late in the process. The assessment exists to find where you are on this progression and build a plan that moves you back.
Continue learning
To understand how the assessment scores the structure, read SBRA — the assessment engine. To see how the scores are used to build a plan, read What is ISRA?. If you are a patient and would like an assessment, the clinic’s booking page is at matibalmualij.com.