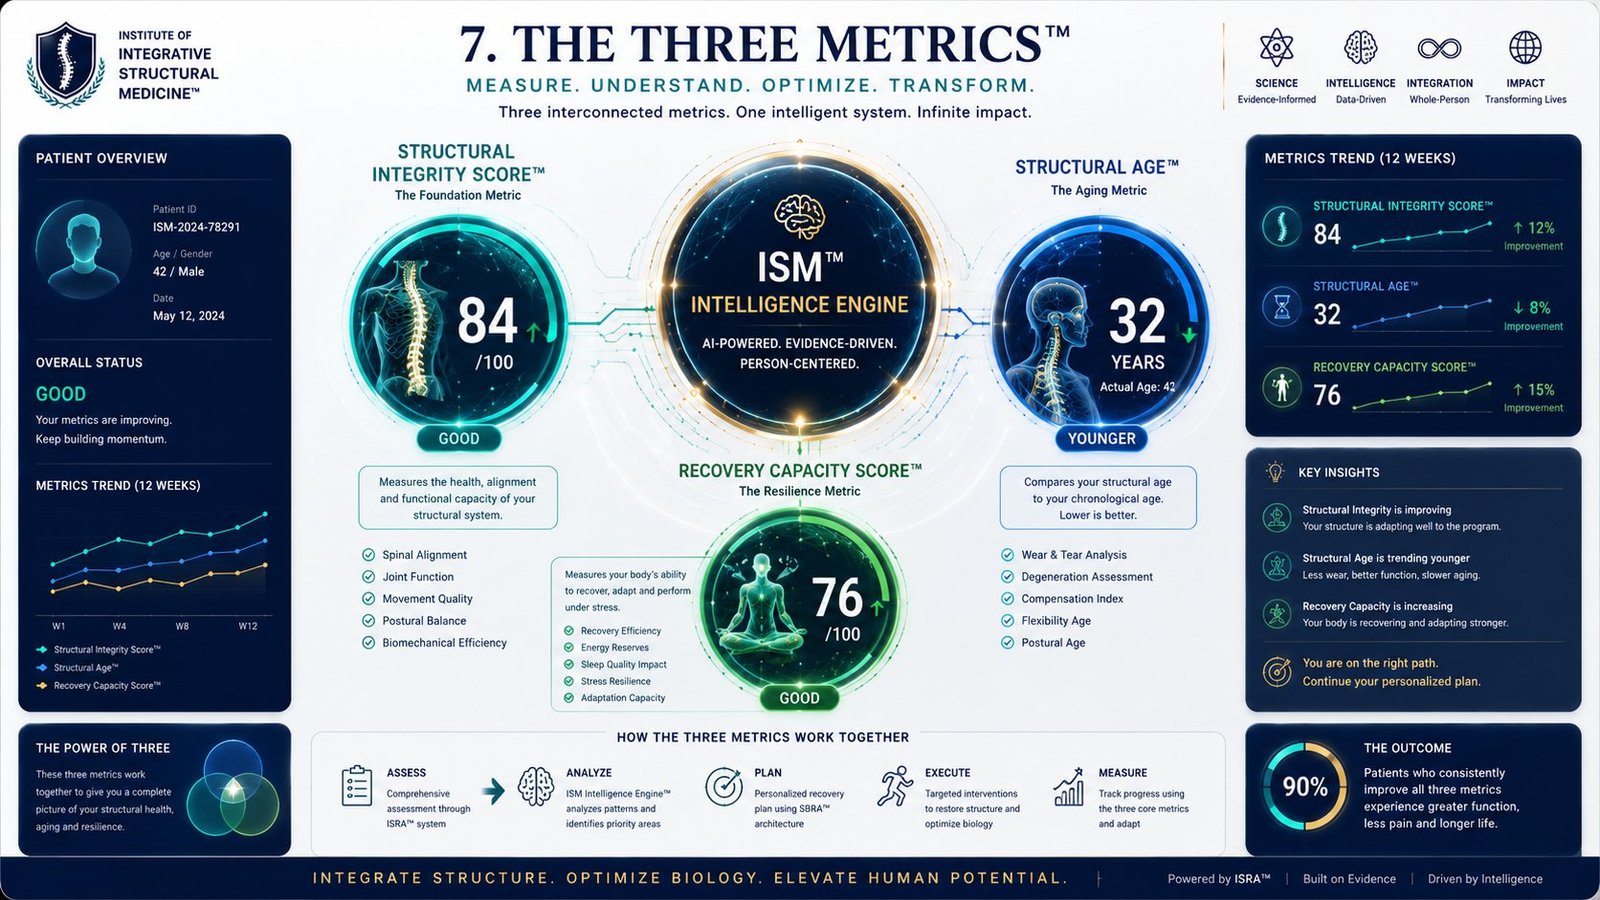
After an ISRA assessment, you receive numbers. The diagram on this page shows the three headline numbers — the three metrics that summarise your structure, your aging, and your capacity to recover. This page explains what each one measures, how the three work together, and what they do and do not mean.
Why three numbers
A single number is easy to remember, but it does not tell you what to do. Three numbers do. Together they give a complete picture: how your structure is doing now, how it compares with your age, and how well placed your body is to improve. The diagram’s tagline is “Measure. Understand. Optimise. Transform.” — the numbers are not the end of the assessment. They are the beginning of the plan.
1. Structural Integrity Score — the foundation metric
The Structural Integrity Score, out of 100, is the headline number. It sums up the condition of your structure — the spine and the musculoskeletal system — based on the five structural pillars: Alignment, Mobility, Joint Function, Biomechanics, and Posture. Each pillar is scored, and the scores are combined into the single number.
The score falls into five bands: Exceptional (90–100) — the structure is in very good condition; Functional (75–89) — the structure is working well, with room to improve; Compensated (60–74) — the body is coping, but it is compensating for a problem somewhere; Significant Dysfunction (40–59) — the structure is struggling, and the problem is affecting daily life; Collapse Risk (below 40) — the structure is under serious strain and needs careful, structured care. The band tells you, honestly, where you stand. It is a starting point, not a verdict, and it is re-measured at follow-up visits.
2. Structural Age — the aging metric
Structural Age expresses the condition of your spine in years. It compares your structure with what would be expected at your age, and gives you a number you can understand at once: the age your structure most resembles, in terms of its condition.
It is not your age. It is a way of talking about condition. A spine can be in better condition than expected for its age, or worse. If your structural age is lower than your actual age, your structure is in better condition than expected. If it is higher, your structure is carrying more strain than expected for your age. The diagram’s rule is simple: lower is better.
Structural Age is a summary, and it rises when several pillars are struggling at once: alignment that is off, mobility that is restricted, joints that are not working properly, posture that loads the spine badly, soft tissues that are weak or irritated, nerves under pressure — and on the biological side, poor recovery, a lifestyle that loads the spine heavily, and sleep and food that do not support repair. The same logic works in reverse. Structural Age is lower when the pillars are in better condition. It is not about being young. It is about being well maintained.
3. Recovery Capacity Score — the resilience metric
The Recovery Capacity Score, out of 100, measures your body’s ability to recover, adapt, and perform under stress. It is the resilience metric: not how damaged the structure is, but how much capacity the body has to repair and improve. It reflects the biological side — recovery efficiency, energy reserves, the impact of sleep, stress resilience, and the body’s capacity to adapt.
This score matters because it sets honest expectations. Two people with the same Structural Integrity Score can have very different Recovery Capacity Scores, and their plans will look different. The person with more capacity can be pushed further, faster. The person with less capacity needs the biological foundations built first.
How the three metrics work together
The bottom of the diagram shows how the three metrics work together: Assess (a comprehensive assessment through the ISRA system), Analyse (the patterns are analysed and the priority areas identified), Plan (a personalised recovery plan, built using the SBRA architecture), Execute (targeted interventions to restore structure and optimise biology), and Measure (track progress using the three core metrics, and adapt the plan as the scores change). The metrics are not measured once. They are measured at every follow-up, so the plan is always based on the latest picture.
Two further outputs complete the picture
The three metrics are the headline numbers, but SBRA produces five outputs in total. The two further outputs complete the picture. Recovery Risk Score — what could slow recovery down or complicate it, so the plan can account for the risks in advance. SBRA Priority Pillar Mapping — the map that turns scores into a plan, showing which pillar needs attention first. A plan that starts in the right place is worth more than one that tries to fix everything at once. The three metrics tell you where you stand. The Risk Score tells you what to watch for. The Priority Pillar Mapping tells you where to begin.
What to do with the numbers
Do not treat any of these numbers as a verdict. Treat them as a starting point and a tool. The Structural Integrity Score tells you where your structure stands. Structural Age tells you how your structure compares with your age. The Recovery Capacity Score tells you how well placed your body is to improve. And when they are measured again, they tell you and your practitioner whether the work is paying off.
Continue learning
To see how the ten pillars behind these scores are measured, read SBRA — the assessment engine. To understand the method that produces these numbers, read What is ISRA?. If you are a patient and would like an assessment, the clinic’s booking page is at matibalmualij.com.